Quick Start#
Importing#
In order to use rgmol, one needs to import it using:
import rgmol
Atom Objects#
- In rgmol, the atoms are objects that contain multiple attributes such as :
atomic_number
name (element name)
pos (the position)
properties (a dict containing various properties such as the radius used for plotting)
The following code presents how to create and view the attributes of an atom
>>> import rgmol
>>> Carbon = rgmol.atom("C", [0.0,0.0,0.0])
>>> Carbon.atomic_number
6
>>> Carbon.name
'C'
>>> Hydrogen = rgmol.atom(1, [0.0,0.0,0.0])
>>> Hydrogen.name
'H'
>>> Hydrogen.atomic_number
1
>>> Carbon.pos
[0.0,0.0,0.0]
>>> Carbon.properties
{'radius': 0.99}
>>> Carbon.properties["electronegativity"] = 2.55
>>> Carbon.properties
{'electronegativity':2.55, 'radius': 0.99}
More details concerning atom objects can be found here.
Molecules Objects#
Molecules, such as atoms are objects introduced by rgmol. They contain the following attributes
* atoms (the list of the atoms in the molecule)
* bonds (the list of the bonds between the atoms)
* properties (a dict containing various properties of the molecule such as Molecular Orbitals arrays
* name (the name of the molecule)
* file (the file used to extract the molecule)
* mol_grids (the atomic grids used)
The bonds list contains lists of 3 integers : [position in the list of atom 1, position in the list of atom 2, order of the bond]
The following code presents how to create and view the attributes of a dihydrogen molecule
>>> import rgmol
>>> H_1 = rgmol.atom(1, [0.0,0.0,0.0])
>>> H_2 = rgmol.atom("H", [1.0,0.0,0.0])
>>> Dihydrogen = rgmol.molecule([H_1,H_2], [0,1,1])
>>> Dihydrogen.atoms[0].name
'H'
>>> Dihydrogen.atoms[1].pos
[1.0, 0.0, 0.0]
>>> Dihydrogen.bonds
[0, 1, 1]
>>> Dihydrogen.properties["condensed function"] = [1.0, 0.0]
>>> Dihydrogen.list_properties()
["condensed function"]
>>> Dihydrogen.list_property("radius")
array([0.83, 0.83])
More details concerning molecules can be found here.
Extracting Data from Calculation Outputs#
Because it is tedious to import manually each atoms to construct a molecule, it is possible to extact data from calculation outputs. One just needs to use the following command
molecule = rgmol.extract_<calculation_output_type>.extract(file)
- The supported DFT calculation outputs are :
ADF
molecule = rgmol.extract_adf.extract(file)
Orca
molecule = rgmol.extract_orca.extract(file)
Molden files
molecule = rgmol.extract_molden.extract(file)
Cube files
molecule = rgmol.extract_cube.extract(file)
Adding data from Calculation Outputs to a Molecule#
It is also possible to add data from calculation to a molecule using the following functions
* Isodensity from a cube file ::

  rgmol.extract_cube.extract_properties(file,mol=molecule)

* Atomic Orbitals and Molecular Orbitals ::

      rgmol.extract_molden.extract_properties(file,mol=molecule)

* Transition densities and dipole moments ::

  rgmol.extract_orac.extract_properties(file,mol=molecule)
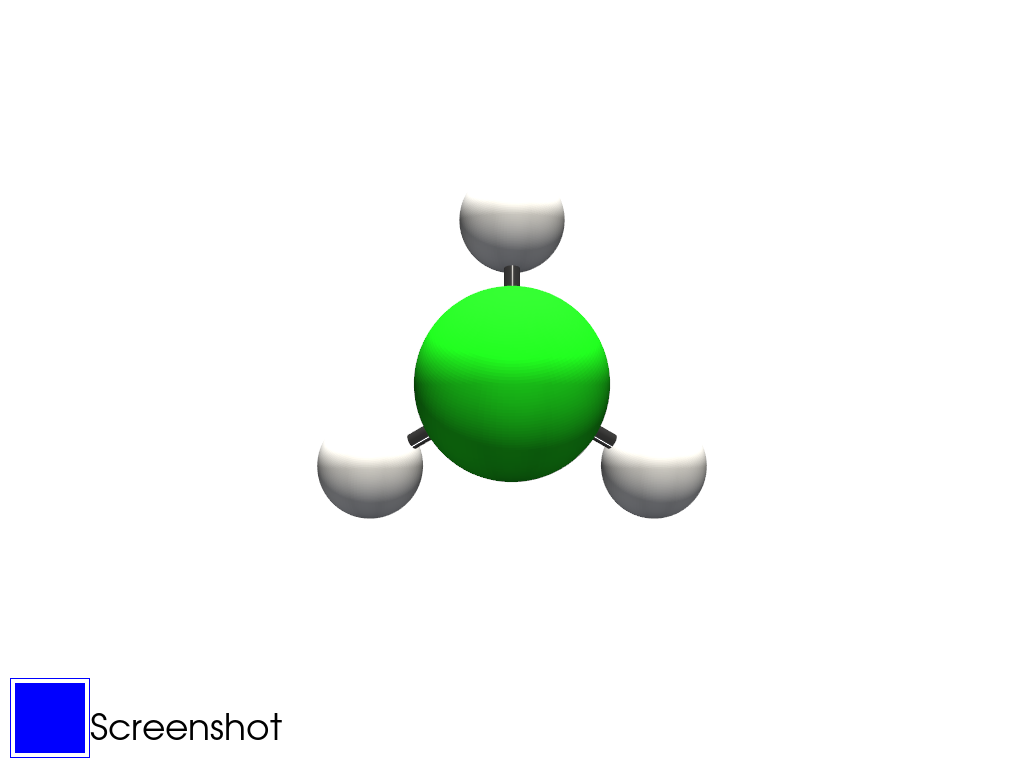
Plotting Molecules#
In order to plot molecules, one should choose the python package used for visualization.
In order to simply plot the molecule, one needs to do
molecule.plot_radius()
The following commands is a detailed script that show a Chloromethane molecule from an ADF example output. The list of examples can be found here.
import rgmol
import rgmol.examples

file = rgmol.examples.adf_CH3Cl
mol = rgmol.extract_adf.extract(file)
mol.plot_radius()
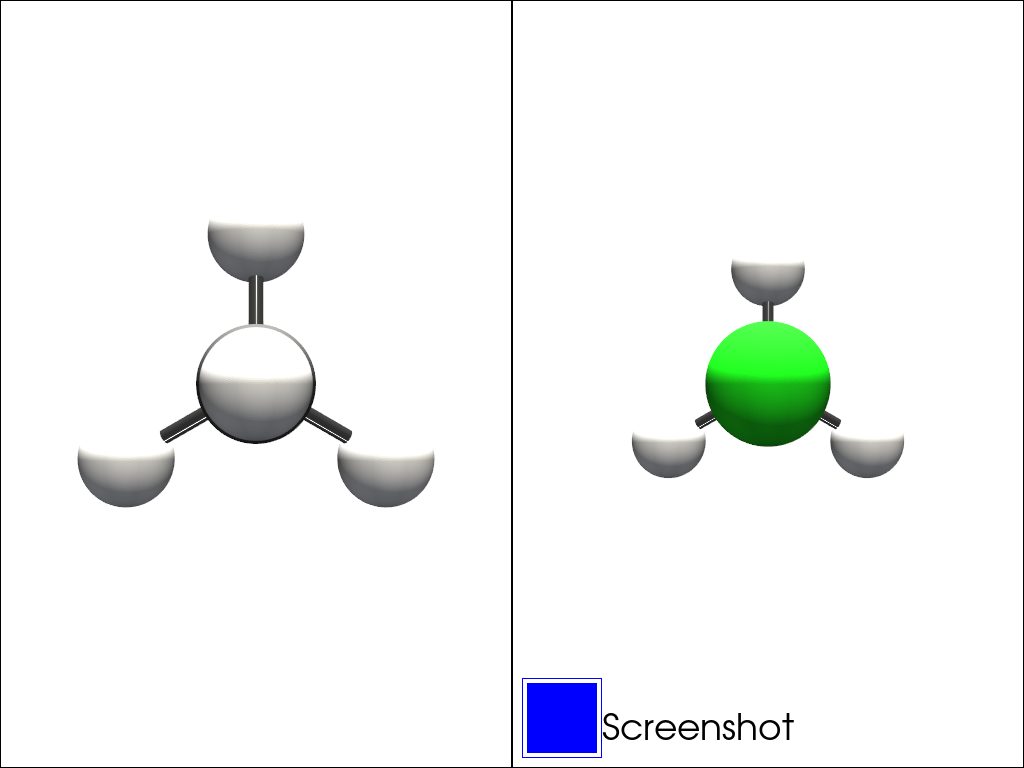
Plotting Multiple Molecules#
Group molecules are deprecated for now and may or may not be reimplemented in the future…
One can plot multiple molecules using the group molecules object. They are built using a list of molecules.
import rgmol
import rgmol.examples

list_molecules = []

file = rgmol.examples.adf_CH4
mol = rgmol.extract_adf.extract(file)
list_molecules.append(mol)

file2 = rgmol.examples.adf_CH3Cl
mol2 = rgmol.extract_adf.extract(file2)
list_molecules.append(mol2)

group_mol = rgmol.group_molecules(list_molecules)
group_mol.plot_radius()